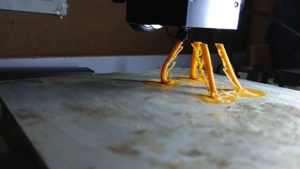
Got an interesting data set, its about FDM printed parts quality parameters such as strength, roughness, distortion and the machine parameters such as nozzle temperature, fan speed, bed temperature, materials etc. There are total 10 features and 50 instances.
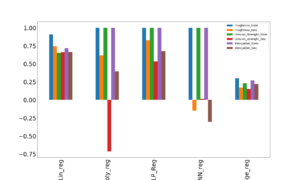
My ultimate aim is to use machine learning to 3D printed part quality parameters prediction where the machine parameters are given. However, in this part i shall stop after doing exploratory analysis of the data-set and find correlation between the input machine parameters and print quality parameters.
The code goes as follow:
import numpy as np
import pandas as pd
import matplotlib.pyplot as plt # plotting
The above block of codes are importing the necessary libraries in python, by the way , I am going to use Python 3.7 Jupyter notebook here.
df=pd.read_csv('data.csv') # importing data setLets check how the dataset looks.
df.head() | layer_height | wall_thickness | infill_density | infill_pattern | nozzle_temperature | bed_temperature | print_speed | material | fan_speed | roughness | tension_strenght | elongation | |
|---|---|---|---|---|---|---|---|---|---|---|---|---|
| 0 | 0.02 | 8 | 90 | grid | 220 | 60 | 40 | abs | 0 | 25 | 18 | 1.2 |
| 1 | 0.02 | 7 | 90 | honeycomb | 225 | 65 | 40 | abs | 25 | 32 | 16 | 1.4 |
| 2 | 0.02 | 1 | 80 | grid | 230 | 70 | 40 | abs | 50 | 40 | 8 | 0.8 |
| 3 | 0.02 | 4 | 70 | honeycomb | 240 | 75 | 40 | abs | 75 | 68 | 10 | 0.5 |
| 4 | 0.02 | 6 | 90 | grid | 250 | 80 | 40 | abs | 100 | 92 | 5 | 0.7 |
Next, before proceeding further if there are any NULL values:
df.isna().sum()layer_height 0
wall_thickness 0
infill_density 0
infill_pattern 0
nozzle_temperature 0
bed_temperature 0
print_speed 0
material 0
fan_speed 0
roughness 0
tension_strenght 0
elongation 0
dtype: int64And there isn’t any.
Let’s create a correlation (Heat map) plot among the different features:
import seaborn as sns #import seaborn librery
fig, ax = plt.subplots(figsize=(10, 10))
#fig, ax = plt.subplots()
#fig = plt.figure(figsize=(5, 4))
#ax = plt.subplots(111)
sns.heatmap(df.corr(method='pearson'), annot=True, fmt='.2f',
            cmap=plt.get_cmap('coolwarm'), cbar=False, ax=ax)

#ax.set_ylim(len(df)-0.5, -0.5)
ax.set_ylim(10,0)
#ax.set_xlim(len(df),0)
#ax.set_ylim(len(df),0)
#ax.set_ylim(0)
ax.set_yticklabels(ax.get_yticklabels(), rotation="horizontal")

#plt.figure(figsize=(10, 4))
plt.savefig('result.png', bbox_inches='tight',pad_inches=0.1)
Conclusions:
- Printed part roughness has high positive correlation with layer height, which is quite obvious because for lesser layer heights, the lines of the layers will merge with each other and will give a smoother finish.
- Printed part roughness has small negative correlation with nozzle temperature, i.e., if nozzle temperature increases roughness decreases. Research showed that for some temperature range its true but not always.
- The printed part strength is directly proportional to the layer height, wall thickness and infill density.
However, the negative correlation suggested by this dataset between the nozzle temperature and part strength is not true, its other way around practically. - The elongation (the measure of ductility) of the printed part is directly proportional to the layer height, as with the increase of layer height lesser numbers of joints of the adjusent layers make it more ductile.
Ok, that’s it for now, we’ll see how to build the machine learning model with this dataset and actually predict the print quality parameters in the next part.
This is Shibashis, signing off for now. Thanks for stopping by at mechGuru.com.
Hi, I am Shibashis, a blogger by passion and an engineer by profession. I have written most of the articles for mechGuru.com. For more than a decades i am closely associated with the engineering design/manufacturing simulation technologies. I am a self taught code hobbyist, presently in love with Python (Open CV / ML / Data Science /AWS -3000+ lines, 400+ hrs. )


Pingback: Maths behind gradient descent for linear regression SIMPLIFIED with codes – Part 1 - mechGuru