The torque diagram of a shaft is analogues to the shear force and bending moment diagram of a beam. It is an important engineering diagram from the pulley shaft design point of view. The steps required to draw it will be discussed with the help of the following example:
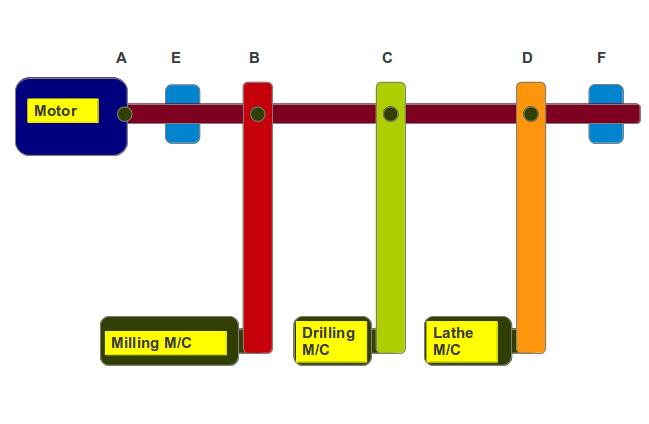
Problem: The below picture is showing a machine shop set up, where three machines namely: milling, drilling and lathe are drawing torques from the main shaft at the points B, C and D respectively. The main shaft is rotating by taking torque from the motor. The bearings E and F are assumed to be frictionless so not taking any torques from the torque, theoretically
The details of the input and output torques are shown below:
Milling M/C – 20 N-m
Drilling M/C – 30 N-m
Lathe M/C – 40 N-m
Solution:
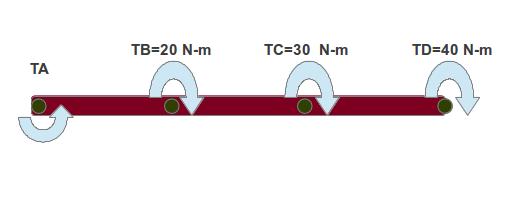
Step-1:Draw FBD of the entire shaft: The FBD of the entire shaft will look like below:

Please observe that the direction of the torque for the motor is opposite than the three machines. This is because the above FBD is showing the reaction torques and the direction of the reaction torques for the machines are opposite to that of the motor for obvious reason. The fact will be re-emphasised from the Step-2 below.
Step-2: Calculate the input torque required from the motor: From the equation for equilibrium, we know that total torque must be equal to zero. So, we can write:
Σ T = 0
Or, TA+20+30+40=0
Or, TA= – 90 N-m
Step-3: Calculate the torque @ section AB: Take a section anywhere between the point A and B and consider the portion of the shaft on the left of the section for equilibrium. The equilibrium equation becomes:
TA + TA-B=0
or, TA-B = – TA=90 N-m
Where,
TA-B – The torque at the section anywhere between A and B
Step-4: Calculate the torque @ section BC: Take a section anywhere between the point B and C and consider the portion of the shaft on the left of the section for equilibrium. The equilibrium equation becomes:
TA + TB+TB-C=0
or, TB-C = – TA-TB=70 N-m
Where,
TB-C – The torque at the section anywhere between B and C
Step-5: Calculate the torque @ section CD: Take a section anywhere between the point C and D and consider the portion of the shaft on the left of the section for equilibrium. The equilibrium equation becomes:
TA + TB+TC+TC-D=0
or, TC-D = – TA-TB-TC=40 N-m
Where,
TC-D – The torque at the section anywhere between C and D
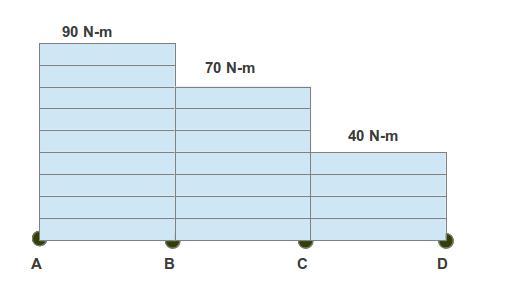
Step-6: Draw the torque diagram: Plot the length of the shaft in X-axis and the torque values (calculated in step-3,4,5) at the different sections in Y-axis. Like below:

The torque values obtained from the torque diagram is used as input for the pulley shaft design.
.
Hi, I am Shibashis, a blogger by passion and an engineer by profession. I have written most of the articles for mechGuru.com. For more than a decades i am closely associated with the engineering design/manufacturing simulation technologies. I am a self taught code hobbyist, presently in love with Python (Open CV / ML / Data Science /AWS -3000+ lines, 400+ hrs. )


so when drawing a diagram I only include the internal forces?